When presenting a term sheet, I am often asked, “how did you come up with this valuation?”
I have heard VCs answer that question ambiguously by proclaiming that “valuing early stage startups is more art than science.” In my opinion, that is akin to admitting that you put your finger in the air and conjure up a valuation based on the way the wind is blowing.
At the series A stage, rarely does valuation reflect the fundamental worth of a business. This has been glaringly obvious as of late. Many startups that commanded nose-bleed valuations last year have quickly been rendered almost worthless. Even without these extreme examples, most series A stage companies have <$3m of revenue, no cash flow, and a short operating history. Using traditional financial valuation methods, most startups with that profile would be disappointed to learn they are worth at most single digit millions.
So what is your startup worth? Below are a few common valuation frameworks. I often use more than one method, but my favorite by far is the Scenario Analysis.
Common early stage valuation frameworks:
- Ownership – focus on owning at least X% of the business for $Y
- Discounted Cash Flow analysis – extremely unreliable with hyper growth startups given the unknowns of input variables
- Multiple – e.g. 1x GMV, 25x ebitda, 15x revenue
- Precedent transactions or comparables
- **Scenario analysis**
- Could this be the next Facebook? If so, pay anything
- Finger in the air
A scenario analysis considers plausible scenarios that could take place and the likelihood of those outcomes coming to pass. It is a way of thinking in probabilities.
I learned this method at Bessemer, where nearly every investment memo includes a scenario analysis.
Scenario analyses are an acknowledgement that the future is uncertain. This is especially true for small startups. There is some chance that the founder gets hit by a bus or throws in the towel. There is some chance of a pandemic that drives tech adoption through the roof. There is some chance bitcoin hits $100k within the next year. Hard to know.
The scenario analysis calculates an expected value of an investment by looking at the weighted average value for a distribution of outcomes. This is what mine typically look like:
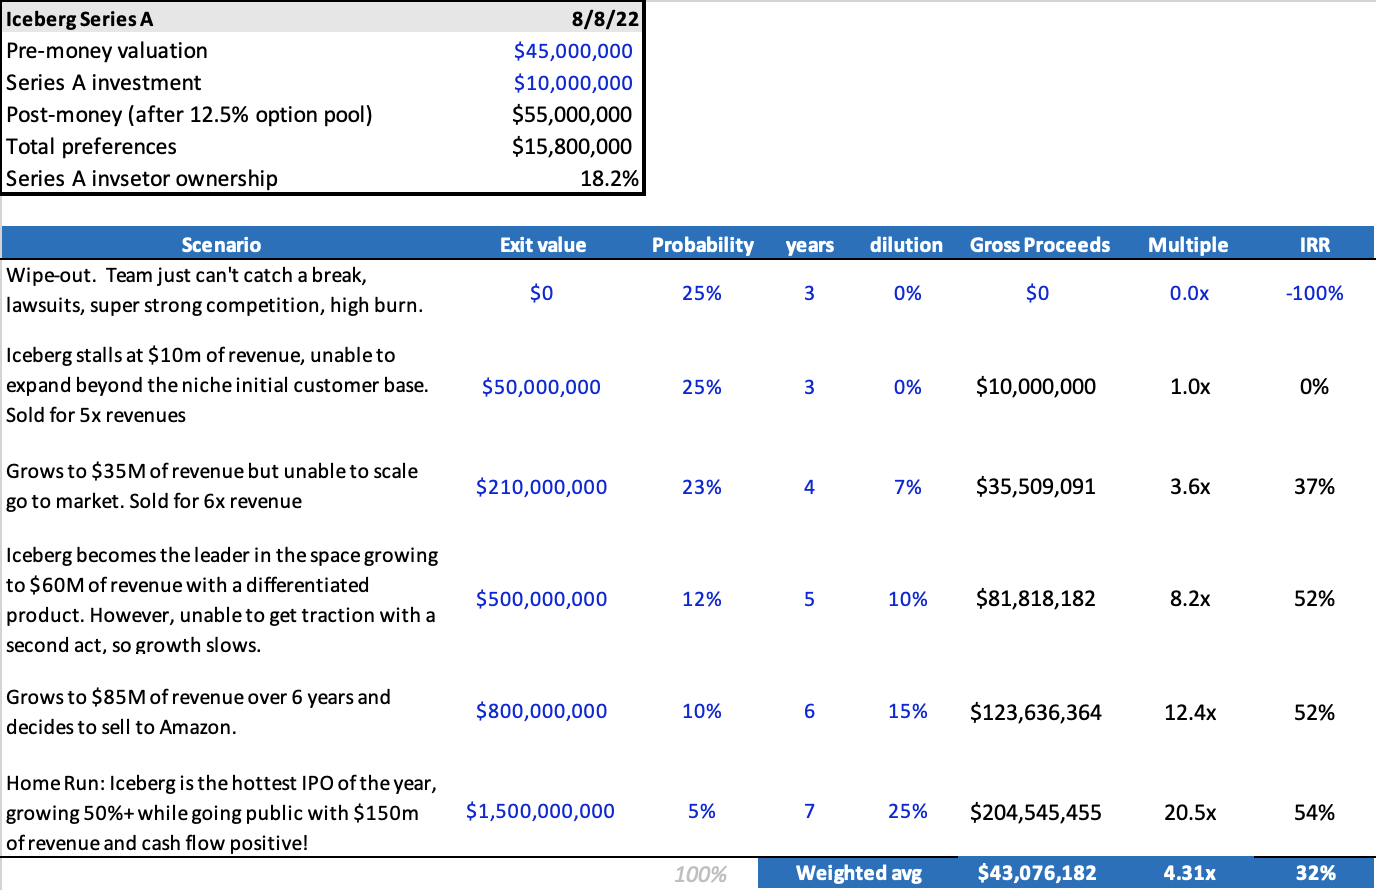
The inputs I plugged into this table have huge impacts. If I increase the probability of the $1.5B outcome to 15%, the expected return would jump from 4.3x to 6.35x! If I increase the “home run” scenario to $10B, it jumps to 10x. But how remote is this scenario?
The ideal way to create “reasonable” assumptions is to compare the distribution of returns and outcomes to your actual portfolio or a dataset of similar venture outcomes. What % of deals at this stage are total wipeouts? If the answer is 33%, then adjust the wipeout probability to 33%. What % are at least 10x? Is this company’s potential is better or worse? If so, adjust accordingly.
This yields an expected value that I can compare to our target fund returns. If I pay 2x the price, the expected value will go down significantly. If that return still attractive, I’ll be much more willing to increase the valuation.
I love this approach to probabilistic thinking. It is impossible to predict the future, so I find this way of thinking liberating.
Scenario analyses are useful beyond setting valuation. Whenever one of my portfolio companies creates a forecast, all I know is that it is wrong. Reality usually proves far better or far worse than the original plan. So I encourage companies to create their own scenarios – downside, base, upside – to proactively consider assumptions and plausible future narratives. The world is chaotic and changing quickly. And that is a startup’s opportunity!

Thank you for publishing this analysis. Always helpful to see how the best investors combine art and science.
With the BVP memos and this analysis, I can’t seem to reverse engineer the weighted average IRR. Using the figures above, I either come up with -22% applying the weightings to the scenario IRRs, or 45% using a weighted avg of the hold period and gross proceeds to calculate IRR. I’ve managed to tie out everything else. Would appreciate any clarity you can provide.
https://docs.google.com/spreadsheets/d/11lwC068XogKCfqsEsqVjURhNOzYexWkG/
Thank you for making this analysis available. Always great to see how the best investors combine art and science to evaluate an opportunity.
I’ve managed to reverse engineer the outputs except for the weighted average IRR. I either come up with -22% applying the weighting across the scenario IRRs, or 45% using the weighted average hold period and proceeds to calc IRR. Any clarity you can provide would be greatly apprecaited.
I uploaded the spreadsheet to google drive so you can check it out in more detail and the formulas. I used the XIRR excel function and input the probability adjusted values (column m) in place of the “cash flows”. It isn’t perfect, but it is a good estimate. https://docs.google.com/spreadsheets/d/11lwC068XogKCfqsEsqVjURhNOzYexWkG/
Thanks for this great post + model! Do you factor in dilution? And if not, how would you think about doing that within this model (for future employee options as well as new shares for new vc’s in the cap table?)